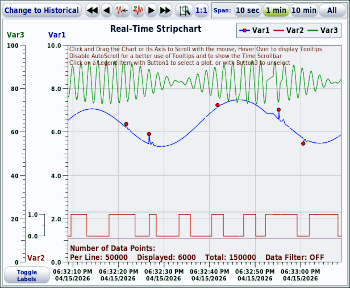
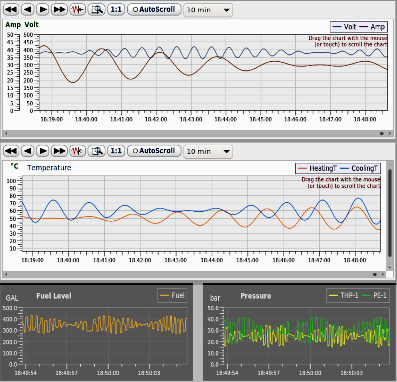
The GLG Toolkit, developed by Generic Logic, is a cross-platform graphics framework used to build visual Human-Machine Interfaces (HMI), SCADA systems, and real-time data-driven dashboards.While it is frequently paired with data acquisition environments, the toolkit itself functions as a high-performance visualization and simulation engine. It handles rendering and updating complex data, while an Open Data API or the GLG Data Gateway allows developers to feed in telemetry from external data acquisition systems.Core Architecture & FeaturesInteractive HMI Editor: The GLG Graphics Builder offers a point-and-click environment to design vector graphics, maps, dials, and custom dashboards. This avoids writing manual rendering code.Data Integration: It is completely data-agnostic. Users bridge it to PLCs, sensors, databases, and message brokers via an API or middleware like ZeroMQ.Real-Time Capabilities: Built to manage high-throughput telemetry data, updating charts containing tens of thousands of data points at ultra-low latencies.GIS Support: Features an optional built-in Map Server component for offline geographic and positional tracking.Multi-Platform Cross-DeploymentDrawings and layouts created inside the Graphics Builder are fully resolution-independent and reusable across diverse backend languages and target platforms:Deployment EnvironmentSupported Technologies & FrameworksWeb & MobilePlain JavaScript, React, Angular, and Next.jsDesktop SoftwareC/C++, C#/.NET (Windows Forms), and JavaOperating SystemsWindows, Linux, Unix, and RTOS (Real-Time Operating Systems)Embedded & IoT HardwareARM-based environments like Raspberry Pi and BeagleBone boards
he GLG Toolkit, developed by Generic Logic, is a highly flexible, multi-platform graphical framework used to build real-time visual interfaces for Data Acquisition (DAQ), SCADA, HMI, and process monitoring systems. Rather than being a standalone piece of data logging software, it is a Rapid Application Development (RAD) toolkit that lets engineers map streaming backend data directly onto dynamic, high-performance dashboards, dials, and plots.🔎 Key Components of the GLG EcosystemGLG Graphics Builder: A point-and-click interactive editor used to design animated vector graphics, custom widgets, and system diagrams without manual coding.Pre-Built Widget Libraries: Includes comprehensive palettes of 2D/3D graphs, real-time strip charts, dials, meters, avionic gauges, and toggles.GLG Data Gateway: A low-latency middleware library built on ZeroMQ that acts as a connectivity bridge, decoupling the user interface from massive telemetry or PLC data streams to ensure smooth performance.💡 Core Capabilities for Data Acquisition & SCADAFeatureDescriptionSupported Technologies / DetailsData Agnostic IntegrationConnects to any backend data acquisition system, database, or hardware bus via a dedicated Open Data API.Custom APIs, PLCs, FieldbusesReal-Time MonitoringHigh-performance charting engines optimized to smoothly render tens of thousands of real-time data points.Strip charts, toggles, alarm tablesMulti-Platform DeploymentWrite or design once, then deploy the graphical layer across desktop, web, or mobile environments.Windows, Linux, Unix, RTOSWeb & Framework IntegrationDeploy dashboards directly into a web browser with zero local installation.JavaScript, React, Angular, Next.jsEmbedded SupportFeatures a lightweight footprint version for ARM-based boards, making it ideal for edge computing DAQ devices.Raspberry Pi, BeagleBone, NVIDIA Jetson⚙️ How It Works in practiceA standard application running the GLG Toolkit relies on a two-part structure:The Drawing (.g file): Created using the visual Graphics Builder, this acts as the "viewport" holding your meters, charts, and animations.The Source Code: A program written in C/C++, C#, Java, or JavaScript that initializes the GLG runtime library, pulls data from your physical sensors or acquisition cards, and feeds those variables into the drawing via resource tags.Note: For non-commercial or evaluation usage, Generic Logic provides a fully-featured GLG Community Edition available for download on their Official Website.